Difference between revisions of "Applications/Gnuplot"
From HPC
m |
m |
||
| Line 48: | Line 48: | ||
=== Graphical Output === | === Graphical Output === | ||
| − | + | ||
[[File:Gnuplot.jpg|left]] | [[File:Gnuplot.jpg|left]] | ||
| − | + | ||
| + | |||
| + | |||
| + | |||
| + | |||
| + | |||
== Further Information == | == Further Information == | ||
Revision as of 09:45, 7 February 2017
Contents
Application Details
- Description : Gnuplot is a portable command-line driven graphing utility for Viper (Linux), and is available on other platforms.
- Versions : 5.0.3
- Module names : gnuplot/5.0.3
- License: Free/Open Source under the GNU license
Modules Available
- module load gnuplot/5.0.3
Usage Examples
Interactive usage
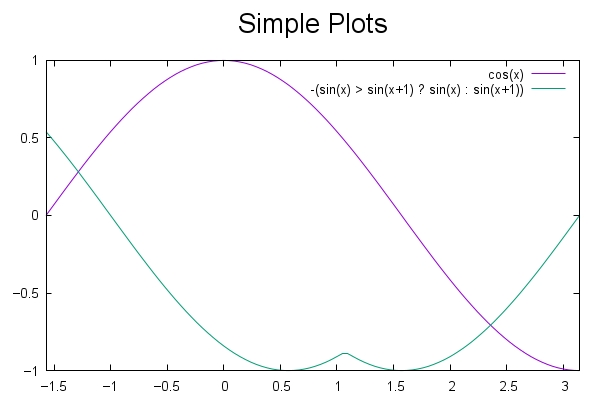
set terminal pngcairo  transparent enhanced font "arial,10" fontscale 1.0 size 600, 400
# set output 'simple.2.png'
set bar 1.000000 front
set style circle radius graph 0.02, first 0.00000, 0.00000
set style ellipse size graph 0.05, 0.03, first 0.00000 angle 0 units xy
set style textbox transparent margins  1.0,  1.0 border
unset logscale
unset paxis 1 tics
unset paxis 2 tics
unset paxis 3 tics
unset paxis 4 tics
unset paxis 5 tics
unset paxis 6 tics
unset paxis 7 tics
set title "Simple Plots"
set title  font ",20" norotate
set paxis 1 range [ * : * ] noreverse nowriteback
set paxis 2 range [ * : * ] noreverse nowriteback
set paxis 3 range [ * : * ] noreverse nowriteback
set paxis 4 range [ * : * ] noreverse nowriteback
set paxis 5 range [ * : * ] noreverse nowriteback
set paxis 6 range [ * : * ] noreverse nowriteback
set paxis 7 range [ * : * ] noreverse nowriteback
set colorbox vertical origin screen 0.9, 0.2, 0 size screen 0.05, 0.6, 0 front  noinvert bdefault
plot [-pi/2:pi] cos(x),-(sin(x) > sin(x+1) ? sin(x) : sin(x+1))
Graphical Output

